Reports on Progress:
Bias effect
 Bias effect due to labels on the scale
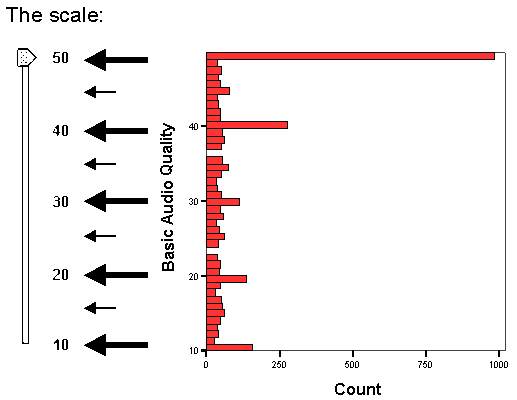
Although listeners were instructed that this scale is continuous (they were free to use any value from the scale), during the listening test they tended to give grades equal to labels more frequently than other grades from the scale. The bias effect is presented on a histogram of the obtained scores averaged for all subject and all experimental factors and plotted against the grading scale (see figure below). Apart from the main bias effect it is also possible to note an additional slight bias effect for grades like 15, 25, 35 and 45 (values exactly between the labels).
"Boundary" effect

|
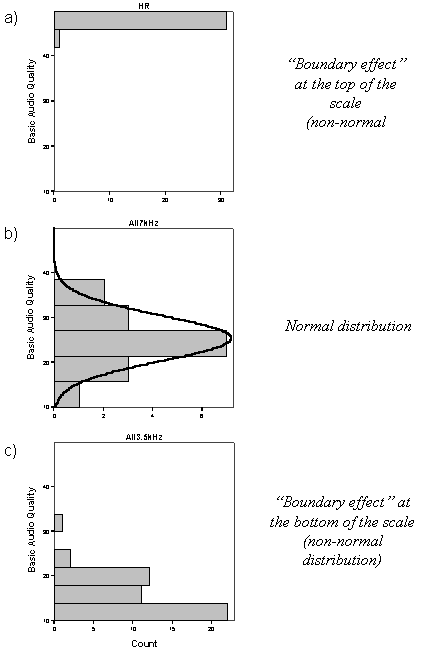
A distribution of obtained scores was examined graphically. This Figure shows 3 typical cases. The first case (a) represents distribution obtained when evaluating "high-quality" items like the hidden reference or slightly impaired excerpts. Its strong departure from normality is caused by a scale "boundary effect" (distribution is asymmetrical due to the end of the scale). Graphical inspection of different cases showed that distribution of scores given to "medium quality" items is usually normal (b). Scores obtained for "highly impaired" excerpts are usually asymmetrically distributed due to another "boundary effect" at the bottom of the scale (c).
|
 Bias effect due to labels on the scale
Although listeners were instructed that this scale is continuous (they were free to use any value from the scale), during the listening test they tended to give grades equal to labels more frequently than other grades from the scale. The bias effect is presented on a histogram of the obtained scores averaged for all subject and all experimental factors and plotted against the grading scale (see figure below). Apart from the main bias effect it is also possible to note an additional slight bias effect for grades like 15, 25, 35 and 45 (values exactly between the labels).
