Reports on Progress:
Audio-Visual interactions
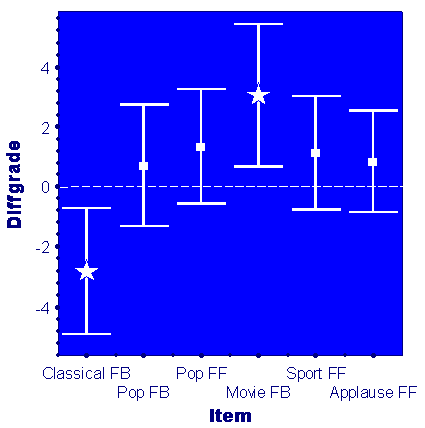
Results presented in this page were obtained in the experiment investigating the effects of low-frequency limitation on audio quality. Similar results were obtained in the experiment investigating effects of high-frequency limitation. Fig. 1 Differences between basic audio quality scores obtained with picture presence and without picture for different programme material. Asterisk denotes that means are significantly different from zero
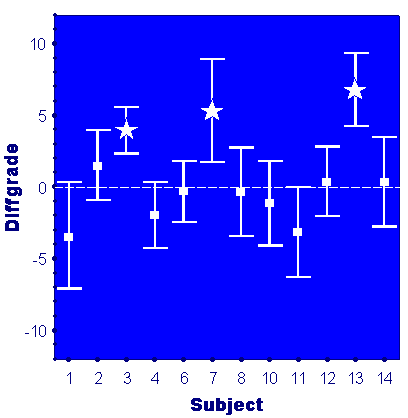
There was no global effect of video presence on grading of audio quality, however small but statistically significant interaction between audio and visual modalities was detected for two items. Figure 1 shows differences between scores obtained during audio-visual presentation and audio-only presentation. Positive mean values show improvement of audio quality due to video interaction whereas negative values indicate deterioration of audio quality caused by video presence (zero represents no audio-visual interaction). For organ music (Classical F-B) the scores given during audio-visual presentations were lower than scores given during audio-only presentation (mean value less than zero). It was probably caused by "boring" video content (static pictures). The opposite interaction was observed for Movie F-B. In that case video presence "improved" the grading of the audio quality. It may be explained by interesting and involving content of the video presentation, which "positively" affected grading of the audio quality. In both cases video presence "shifted" the scores up to 3 % only, which shows that mentioned effect is small, however statistically significant. This observation is in line with results obtained Beerends et. al. (1999). It was also found that some of the listeners are more susceptible to video influence than others. For example, subjects No. 3, 7 and 13 had tendency to grade audio quality slightly "better" for audio-visual presentation than for audio-only one (Fig. 2). In general, obtained results showed that video presence had a small (but statistically significant) effect on audio scores.
 Fig. 2 Differences between basic audio quality scores obtained with picture presence and without picture for different subjects